
But, the good news is we can see what’s coming.
Introduction
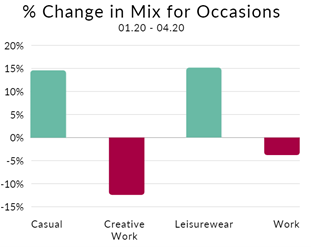
As we identified in January’s blog, return rates for clothing dropped significantly over the course of the pandemic. This was attributed to two main factors, the change in the mix of purchases from different categories (fewer dresses, more leggings and tracksuit bottoms) and changes in returns rates within each category (more casual wear and less trend, work and occasion wear).
Now, as lockdowns are easing, consumer purchasing habits suggest a resurgence of excitement to go out and look good. So much so that retailers are beginning to see return rates reaching their pre-pandemic levels, and even in some cases, exceeding those rates. In fact, over May and June, return rates are up 9.1% on 2020 and 4.9% on 2019 (something we also predicted in our January blog!).
Customer basket behaviors and category mix aligns well with restrictions being imposed and lifted. The benefit of this means that going forward, depending on the status of various restrictions, it should be relatively easy to predict return rates ahead of time.
What happened over lockdown
1) Casualisation of Fashion
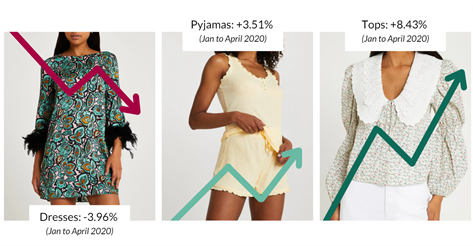
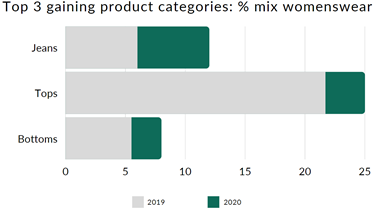
Data from throughout the lockdown period suggests a permanent casualisation of fashion. Consumers got used to being at home and with that came habits of more comfortable and informal clothing. There were more purchases of t-shirts, basic tops and jeans alongside decreases in purchases of dresses - particularly event and occasion dresses - and work attire.
The recent announcement that M&S is halting suit sales in the majority of its stores is just one example of the impact the pandemic had on how consumers are filling their closets.
Impact on Return Rates
Consequently, most fashion retailers found themselves in the happy position of increased demand and lower return rates. See below for an example of the impact increased online demand and decreasing return rates had over 2020:
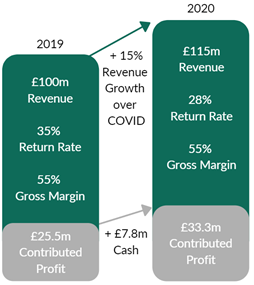
This chart shows the difference between 2019 and 2020 for a typical online fashion retailer. Most fashion retailers saw online revenue growth of at least 15% and reduced return rates by somewhere between 8-10%, delivering significant cash and EBIT rewards.
Even as purchases began to normalise after the first lockdown, retailers continued to see lower-than-normal return rates. This came from the continued popularity of casual clothing which have always had lower return rates than more formal wear.
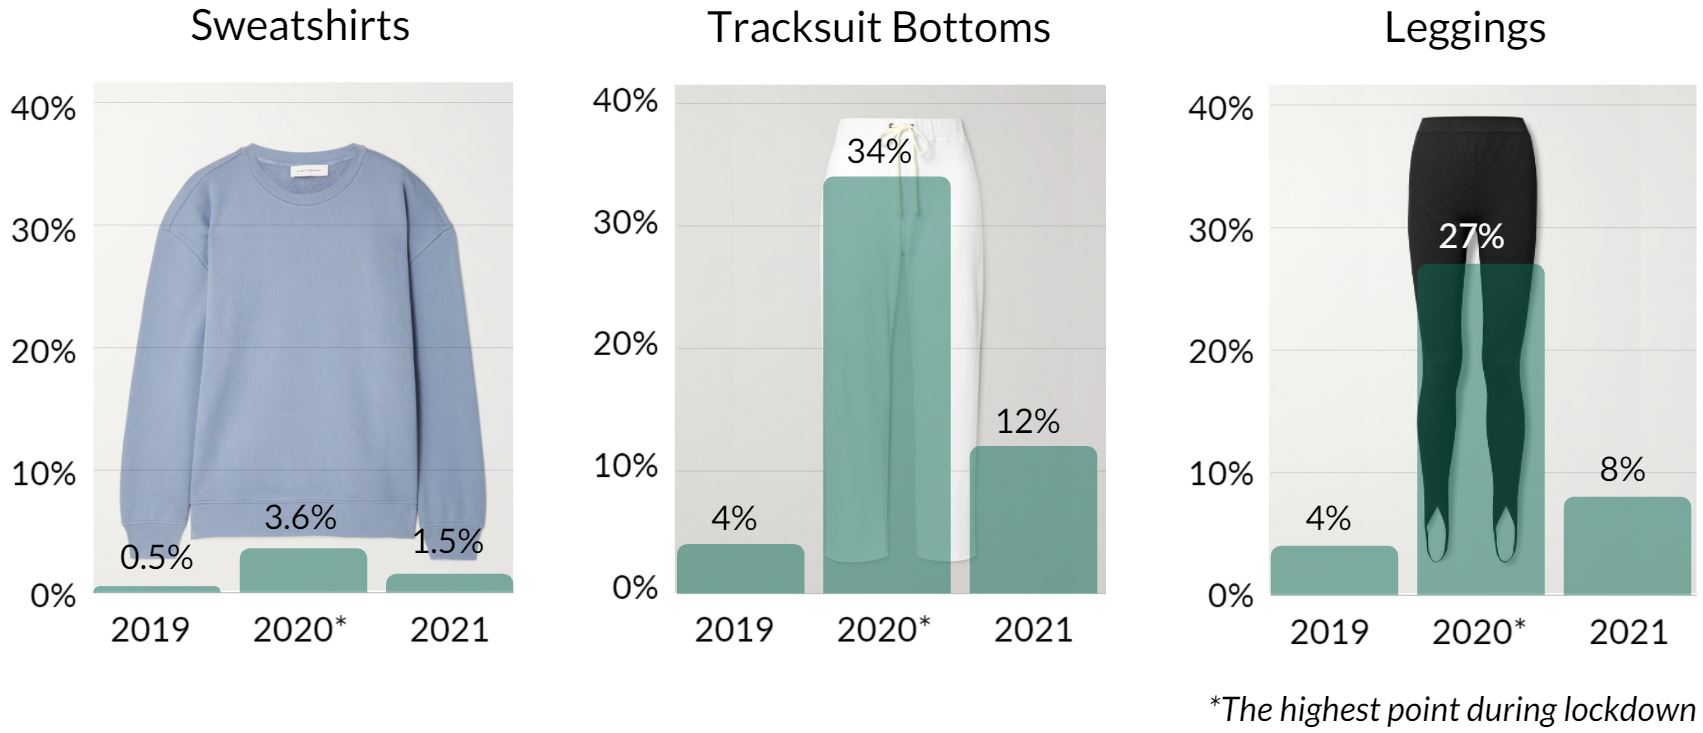
2) The Lockdown Exercise Splurge
Additionally, with the exercise craze that came with lockdown, activewear became a very popular purchase. These items are infrequently returned, so they further decreased the return rates witnessed by retailers. However, early indications show that as lockdowns come to an end, so is the workout fad and with that, the purchase of workout clothing is decreasing again.
All these indicators could have led to a false sense of security for many fashion retailers.
Building Up to and Post Freedom Day
1) Customer Demand
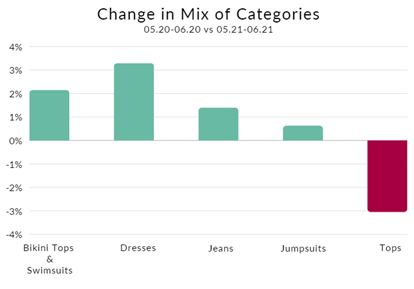
Now, as the vaccinations are rolled out in earnest and lockdowns are easing, the pent up need to socialise and look good is catching up - something which is evident in consumer behavior:
- The sales of dresses are booming (up 5.6% on 2020 and 9% on 2019) with evening and occasion dresses increasing alongside shorter dresses
- The mix of jumpsuits and swimwear is increasing (up by 1% on 2020 but still down on 2019)
- Tops as a % of products bought is down by 1.5% on 2020 but still up 3% on 2019
- The data also shows an increase in event and highlight pieces (up 8.55% on 2020)
Impact on Return Rates
However, with these changes in item types and categories comes a higher return rate. Some retailers are experiencing their return rates returning to - and in some cases even exceeding - pre-pandemic levels.
These increased return rates can be attributed to the frenzy surrounding the nation’s reopening and excitement to step out on the right foot - and in the right outfit.
Similarly to going into lockdown, the increased return rates coming out of lockdown are partly due to a change in the mix of products, and partly due to the change in garment type and customer behavior within each category.
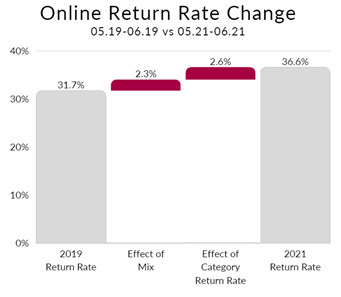
The chart below shows the change in return rates specifically since the lifting of restrictions were announced and enacted. It compares the return rates for Dresses, Jumpsuits, Bottoms and Tops for May and June 2019 and the same period in 2021. As is visible in every case, the return rates for those categories are higher than they were in 2019.
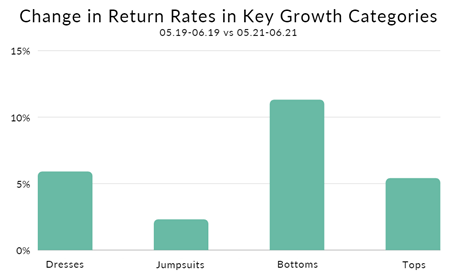
Within each category, the increase is also due to rises in the % of trend pieces, event, and occasion wear.
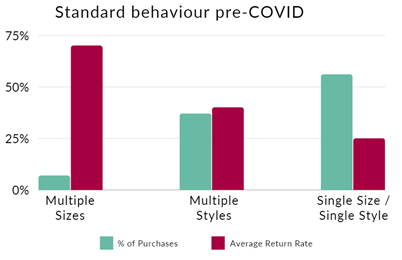
How customers fill their baskets also gives a good indication of future return rates. If customers buy the same product in multiple sizes, return rates are typically around 70%, if they buy multiple options of the same category, return rates are typically lower around 40% and if they buy single products in a single size, return rates are typically around 25%.
Pre lockdown, the general split of purchases was as follows:
Throughout lockdown, multiple size purchases stayed pretty flat, but multiple style options reduced by 7% and single style single purchases increased by a similar %.
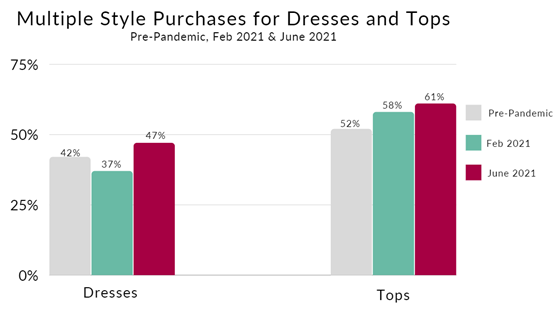
Since restrictions have eased, consumers are starting to go out more, and so are more inclined to use their homes as changing rooms. As a result, there has been a marked increase in customers buying multiple style options, particularly for Tops and Dresses (where customers are looking for the “perfect” dress or top for their upcoming event or night out).
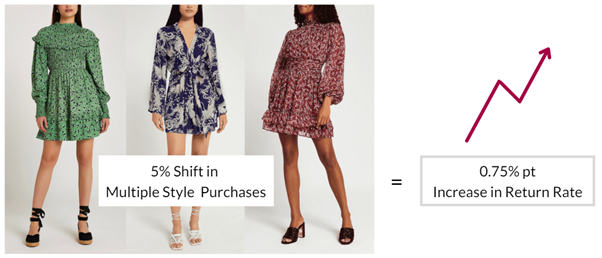
This has also had a detrimental impact on return rates. Every 5% shift from single size/single style to multiple style purchases increases return rates by approximately 0.75% points.
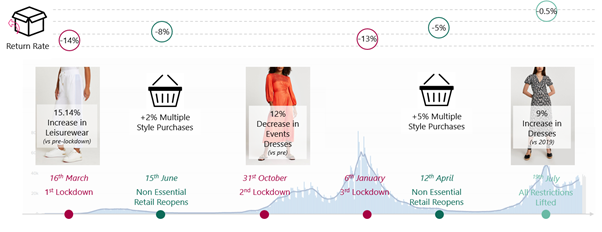
The reassuring thing is that we are predictable creatures with predictable behaviors, as is evident in the COVID timeline below. We have annotated customer demand, purchasing behavior, and return rates, and there is a visible correlation between all three.
Forecasting into Q4 2021 and 2022
As we continue to return to normality, we expect the initial excitement around the reopening to settle down; as will the return rates. We can predict that the movement towards more casual clothing will be a permanent shift in consumer wardrobes.
So, assuming no further lockdowns, we would expect return rates to settle to around 5% lower than their pre-pandemic levels.
However, we do live in uncertain times. It would be wise for retailers to keep track of the data surrounding consumer behavior, changes in purchase of garment and occasion types, and basket behavior. Staying on top of this data will make it easier to keep abreast of returns and associated costs.
We wanted to extend a big thank you to Tara Tadjbajhsh, our amazing summer intern who did most of the analysis and work going into this article!
Read our other analyses of return rate trends here: Fashion Returns: A Headache for Retailers and the Environment | 10 January 2022 The Truth Behind Reduced Return Rates | 08 January 2021 How To Make Your Data Work Harder To Reduce Garment Return Rates | 14 November 2017